There is a ton of data available for businesses, and not all of it is useful for guiding business decisions. That’s why business owners identify their KPIs, or Key Performance Indicators, which reflect the values considered most important to the business. Because every business is unique, KPIs may vary even within the same industry.
That said, some data is universally useful to business owners. At Pike13, we’ve made note of the reports that our customers, regardless of industry, run regularly. Keep reading to learn what those metrics are and how to access them in Pike13’s Premium Reporting powered by Looker.
What is a KPI?
KPIs help you track the overall health of your business and see what data trends have developed over time. They measure a value that demonstrates how effectively a company is achieving key business objectives. As a business owner, you get to decide what KPIs are most important to you.
Most of the time, businesses report on their KPIs monthly. But you can also look at the data quarterly, annually or weekly. The reports provide even more value if you compare data over time, allowing you to see any patterns, trends, and gaps.
The Most Popular KPIs Among Pike13 Business Owners
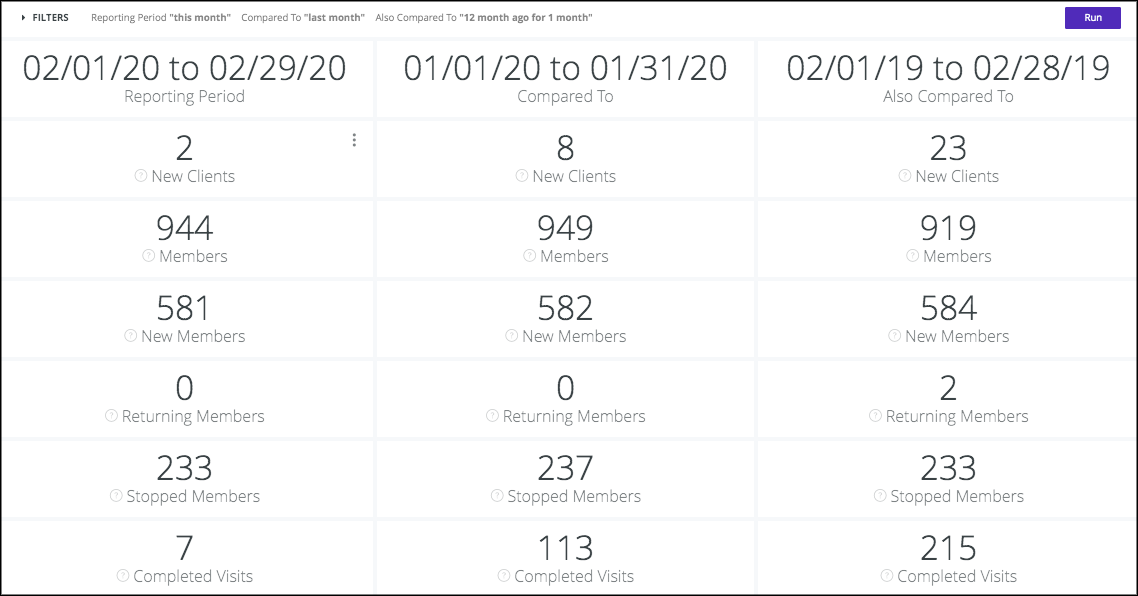
New clients, member changes, completed visits, and financial numbers are the most requested KPIs from Pike13 customers. Broadly, we categorize these into Client KPIs and Financial KPIs. Now let’s get a bit more specific:
Client KPIs
- New Clients: Total number of new clients signed up
- Members: Total number of clients with membership
- New Members: Clients whose first membership started during the time period.
- Returning Members: Number of former members who started a new membership during this period.
- Stopped Members: Number of members who stopped being a member at the end of the time period. They don't have any future memberships.
- Completed Visits: Total number of completed visits.
Financial KPIs
- Invoices Due: Total expected amount of invoices due in the time period.
- Past Due Invoices: Total unpaid amount of invoices that past due in the time period.
- Net Paid: Total net paid amount of transactions made in the time period.
It’s no surprise that these are the metrics considered most important to Pike13 business owners. The Client KPIs track trends in client engagement, acquisition, and retention. The Financial KPIs ensure that there are no revenue leaks negatively affect your bottom line. Together, these KPIs present a good summary of the overall health of your business.
Tracking KPIs in Pike13’s Premium Reporting
In Pike13 Premium Reporting, powered by Looker, the default time frame for a KPI is monthly. By default, we’ll show the numbers for the current month, previous month, and the same month previous year. You can customize the date ranges by changing the filters on the dashboard.

Because the KPIs mentioned earlier are so popular, we’ve pre-built reports in Premium Reporting to monitor each one of them.
Your Client KPIs are found under Premium Reporting > Clients & Staff.
Your most important numbers are presented clearly for quick reference. You can also compare your performance this month to last month and the same month of the previous year. These comparisons reveal patterns and trends in member engagement, and help you make data-driven decisions about your business.

Financial KPIs are located under Premium Reporting > Financial.
The Past Due Invoices KPI is a particularly useful number. It allows owners to identify and reach out to unpaid clients before the lack of payment becomes a problem for the business. Accurate financial data isn’t just important for maintaining your business now; it also helps you realistically forecast for the future.

The KPIs in this dashboard are presented as currency amounts, which will match the currency of the country where your Pike13 business is located. So for example, the dashboard above is for a business in the United States. This business has $0 in past due invoices so far this month, but at the same point last year there was $1,507.30 of unpaid bills.
To clarify what any of the KPIs are measuring, hover over the question mark that’s just to the left of each metric name.
We hope these new KPI dashboards will be helpful to you as you make decisions for your business. Did we miss your favorite KPI? Let us know in the comments!
